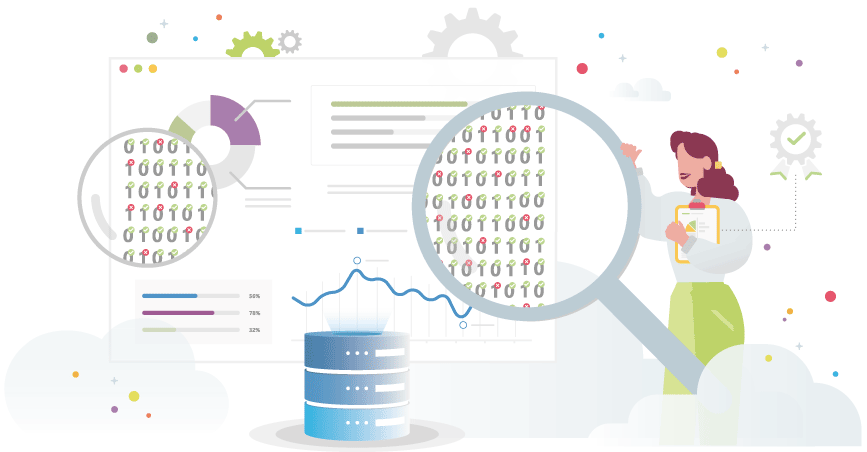
Is your latest Generative AI initiative not delivering the expected results? Do business reports take days of manual reconciliation? The issue probably isn’t with algorithms or people, but with the foundation: the quality of your data. We don’t build houses on cracked foundations—so why build our business on unreliable data?
According to Gartner, as early as 2020 (well before the current “rush” to implement AI solutions), poor data quality was already costing organizations an average of \$11 million per year. That estimate has since risen to $12.9 million (+19%), with an even more troubling insight: 60% of the companies surveyed in 2024 had no idea what the actual financial impact of this issue was.
But the real damage, now more than ever, is strategic: slower decision-making, eroded trust, and above all, the inability to seize the opportunities offered by Artificial Intelligence. As highlighted by the reliable Data Products. Data Quality is increasingly stepping out of its traditional role as a technical discipline to become vital fuel at the very heart of the business.
Moreover, Article 10, “Data and data governance”, of the AI Act—the legal framework enacted by the European Union on Artificial Intelligence—explicitly mandates requirements for data quality, governance, and traceability for “high-risk” AI systems. Examples include: banking and insurance scoring for credit access or premium calculation, recruitment processes, infrastructure management, biometric systems, automated assessments, judicial decision support, predictive policing, and border control.
According to the Global Data Management Community (DAMA), Data Quality “consists of the planning, implementation, and control of activities that apply data quality management techniques to ensure that data is fit for purpose and meets user needs.” Speaking of DAMA International, in the summer of 2025 the global kickoff took place for the update of the DMBOK® (Data Management Body of Knowledge) to its third edition.
Why should a company implement a Data Quality system?
Gartner already noted five years ago (Gartner: *“5 Steps to Build a Business Case for Continuous Data Quality Assurance”*, April 20, 2020, Saul Judah, Alan D. Duncan, Melody Chien, Ted Friedman) that the estimated financial losses due to “poor data” were bound to increase “as business environments become increasingly digitalized and complex.”
Information is the foundation of every business process, and the quality of the data that is collected, stored, and used inevitably affects both today’s and tomorrow’s business. “Poor data quality destroys business value,” Gartner emphasizes, because data leads to the information that builds knowledge and generates business insights—insights that, in turn, create competitive advantages and secure market positioning. We can therefore compare data to the foundations of a house: only if they are solid can we expect to withstand even the toughest shocks.
Birth dates set in the year 2190, sequences of identical numbers used as VAT IDs, addresses made up of nothing more than a street name—these are just a few of the anomalies found in a company’s databases. But while an incorrect address might result in a missed contact with a customer or potential lead—causing a loss—the consequences are very different when a wrong data point is used to determine a risk profile.
Even more dangerous is delivering reports with inaccurate data to management, which can lead to distorted strategic decisions and impact the organization’s financial performance. This also creates significant mistrust among employees toward the data, undermining its credibility and discouraging its use.
To remain competitive, it is essential to build a system for verifying data quality, ensuring that reliable information is available for the intended business use, while also meeting process cut-off times. Additionally, it is crucial to be able to trigger well-structured diagnostic actions and carry out the structural removal of identified anomalies.
What are the methods of application and the main control criteria?
Building a Data Quality system is a long-term effort. Going into detail for each phase would require writing a book, but in summary, we can outline a few key steps:
- The definition of a company-wide policy that outlines the “rules of the game” for all stakeholders involved;
- The identification of a pilot scope in which to map the data present across the various phases of the process, and on which to carry out appropriate transformation and control steps using a rule-based system—including rules expressed in natural language (such as technical rules, e.g., checking for correct date format, and business rules, e.g., a closed loan must have a zero balance, or reconciliation rules, once the data to be compared has been properly normalized);
- measure, and monitor the quality of data on an ongoing basis by implementing a set of supporting indicators;
- undertake any necessary actions to resolve detected anomalies and drive structural improvements;
- expand to new use cases.
The most time-consuming part is likely the design of control systems that verify data compliance against a set of criteria, generate results, and allow the detection of anomalous data. In 2013, DAMA UK (DAMA-DMBOK Chapter 13) identified six dimensions along which to align technical and business controls:
- Completeness: the percentage of data recorded compared to the full potential (100%);
- Uniqueness: no instance (thing) of the entity should be recorded more than once, based on how that thing is identified;
- Timeliness: the degree to which the data reflects reality at the required point in time;
- Validity: data is valid if it conforms to the syntax (format, type, range) defined for it;
- Accuracy: the degree to which data correctly describes the real-world object or event it represents;
- Consistency: the absence of discrepancy when comparing two or more representations of a “thing” against a given definition.
The criteria listed above are, of course, only a selection from a broader set of data quality dimensions recognized in the literature. While the six dimensions tell us “what” the health status of the data is at a given moment, Data Observability helps us understand “why”—and how to prevent future issues. It’s a holistic approach that continuously monitors data health across the entire pipeline, not just in the final database. As Gartner puts it, it is “an organization’s ability to have broad visibility into its data landscape and multi-level dependencies.”
“Observing” data pipelines means being able to monitor not only static quality, but also data freshness, volume, schema, and lineage—essentially in real time. This allows anomalies to be detected (for example: a sudden drop in records within a data stream) before they impact business processes.
In other words: traditional Data Quality can be seen as an annual medical check-up—a snapshot of your health; while Data Observability is more like a fitness tracker, a smartwatch that monitors your vital signs 24/7, alerting you to potential anomalies (like an irregular heartbeat) as they occur and allowing you to act before they become more serious problems.
How should Data Quality metrics and indicators be structured?
The proper ongoing functioning and performance improvement of a Data Quality system depend on the availability of a set of measurements—after all, you can’t improve what you don’t measure. A system of metrics must reflect the organization’s core informational needs:
- it’s important to identify a few key measures and focus reporting efforts on those. While it’s true that “you can’t manage what you can’t measure,” it’s equally true that “measuring comes at a cost.”
- as a general rule, metrics should be as systematized as possible—that is, cohesive and logically connected to one another. It’s important to maintain consistency in the terminology and definitions used for the metrics;
- the system should be balanced, meaning it should include various types and perspectives of metrics, weighted according to their representativeness;
- it’s advisable to present the metrics grouped by related categories or types;
- the purpose of metrics in a Data Quality system is not to measure individual productivity or quality, nor to encourage competition between people or departments, but rather to measure the quality of the product (the data) and the processes. For example: instead of measuring the number of data flows validated per day, it is more meaningful to measure the number of error-free flows. Measuring individual performance can be tempting, but it is undoubtedly one of the most harmful practices for a quality initiative. The only acceptable performance measurement—if any—should be at the workgroup level.
- a metric should always be empirically validated across a variety of contexts before being published.
Why does Irion EDM enable the creation of an effective Data Quality framework?
As the number of information domains to be monitored and the number of controls to be managed, qualified, executed periodically, and measured increases, a Data Quality system finds essential support in the use of technological tools to automate the most demanding tasks—such as running scheduled checks, calculating quality metrics, and generating reports.
Irion has delivered hundreds of projects in this field, developing a platform that shortens setup times and speeds up the implementation of control procedures—all while fully adhering to corporate policies. A few examples?
- powerful control engines capable of performing 2.5 million checks per minute, verifying over 60 million records;
- a flexible, collaborative Data Quality Governance framework to support interaction among various data specialists;
- an effective system for managing remediation and handling low–quality data issues;
- a module that allows organizations to adopt metrics already tested by various companies, or to define, calculate, and analyze any type of indicator across any type of business process;
- automation features that intelligently generate technical rules from metadata—in just a few seconds.
Irion EDM is currently used by 8 of the 10 largest banking groups in Italy, half of the leading insurance companies, and major enterprises and complex organizations across sectors such as energy, utilities, transport, logistics, and public administration. Here are some examples within the scope of advanced Data Quality solutions:
- Major financial institutions use our platform daily to certify the consistency and formal correctness of sensitive tables in massive databases containing millions of transactions, safeguarding regulatory reporting and minimizing the risk of penalties.
- A leading Italian bank uses an “Accounting Reclassification Engine” based on Irion to automatically classify 400 million daily transactions, ensuring consistency between accounting, financial statements, and supervisory reporting—while complying with the strict requirements of Banca d’Italia’s Circular 285.
- For a major credit institution, Irion manages the automated deletion process (the “Right to Erasure”) of personal data after a defined period, operating across multiple critical Finance and Treasury databases—ensuring full compliance with GDPR.
Irion EDM and the modern vision of DQ
Irion is the only Italian company featured in Gartner®’s 2025 Magic Quadrant™ for “Augmented Data Quality Solutions.” A modern Data Quality framework needs a powerful and flexible engine like Irion EDM—the platform that enables this strategic vision by allowing you to:
- Automate and scale: perform millions of checks per minute on tens of millions of records
- Centralize Data Governance by
- Enable Data Observability by monitoring the reliability of Data Products
- Automatically generate rules: leverage metadata to create automated control rules, accelerating implementation
- Engage the Business: provide intuitive interfaces for rule management, remediation, and Data Justification
Ignoring data quality today means building your digital future—based on AI, data-driven decisions, and automation—on fragile, crumbling foundations. It means feeding your algorithms with “garbage data,” and getting unreliable results in return. Patching the cracks isn’t enough: we need to repair the foundations of our house (business) at their core. Beyond the classic dimensions of data quality, embracing the new paradigm of observability and the power of automation is a crucial first step to transforming data from a hidden risk into a core business asset.